

How to Build a Marketing Attribution Report with AI (Two Ways)
A 10-minute play using Claude + HubSpot, and a weekend build for teams that want the full picture.

The Starter Play: How to Build a Marketing Attribution Report in 10 Minutes Using Claude + HubSpot (or your CRM)
Marketing attribution has been the thing everyone wants but it’s hard to generate. You know the conversation — “we need to understand what’s driving pipeline” — but it can take weeks to pull, clean and analyze the data to get a directionally correct answer.
Here’s the thing: if your data is in HubSpot (or any CRM that has a connector to Claude), you can have a working attribution report today that tells you what marketing activities are actually correlating with closed revenue.
Before You Start
Claude account with the HubSpot connector enabled (this is key — without the connector, Claude can’t read your data). If you are using a different CRM, just make sure that it is also connected to your Claude account and follow these same instructions).
HubSpot access with closed/won deal data and at least some marketing activity tracked against contacts
A rough idea of the time window you want to analyze (last 6-9 months is a good starting point)
Deals should have contacts associated — Claude reads contact-level properties, not just deal records
Step 1: Connect Claude to HubSpot
In Claude, open a new conversation and enable the HubSpot connector from the tools panel. You don’t need to export anything or build a prompt file ahead of time. Claude reads your HubSpot data directly once the connector is active.
Step 2: Run the Attribution Prompt
Start with this prompt, adjusted for your time window:
“Look at every deal that closed won in the last 9 months. Analyze the activity of each contact associated with those deals. Determine what marketing activities generated closed revenue. Give me an executive summary with: total revenue, average deal size, time to close, and the top marketing touchpoints correlated with winning. Then break it down by deal tier if you can.”
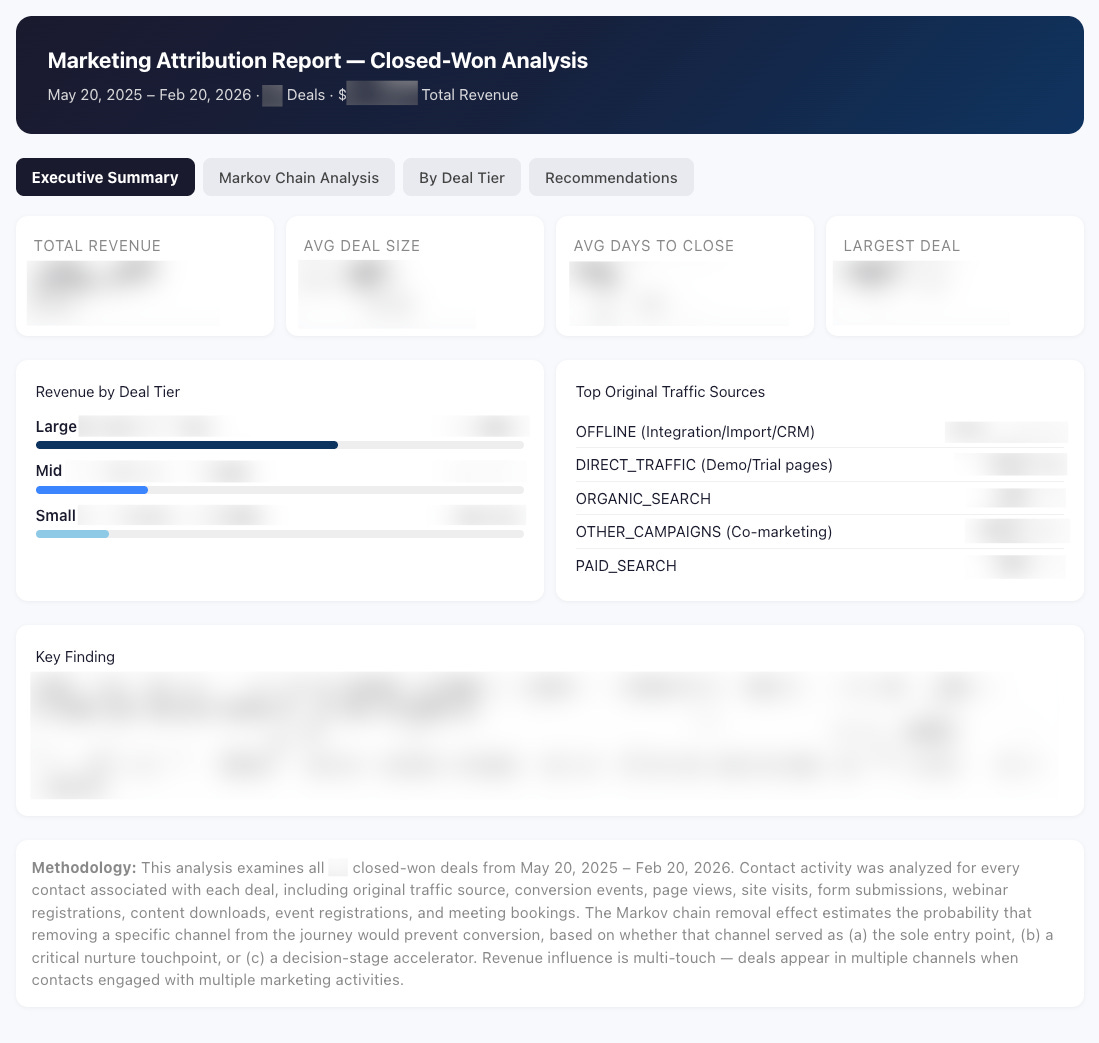
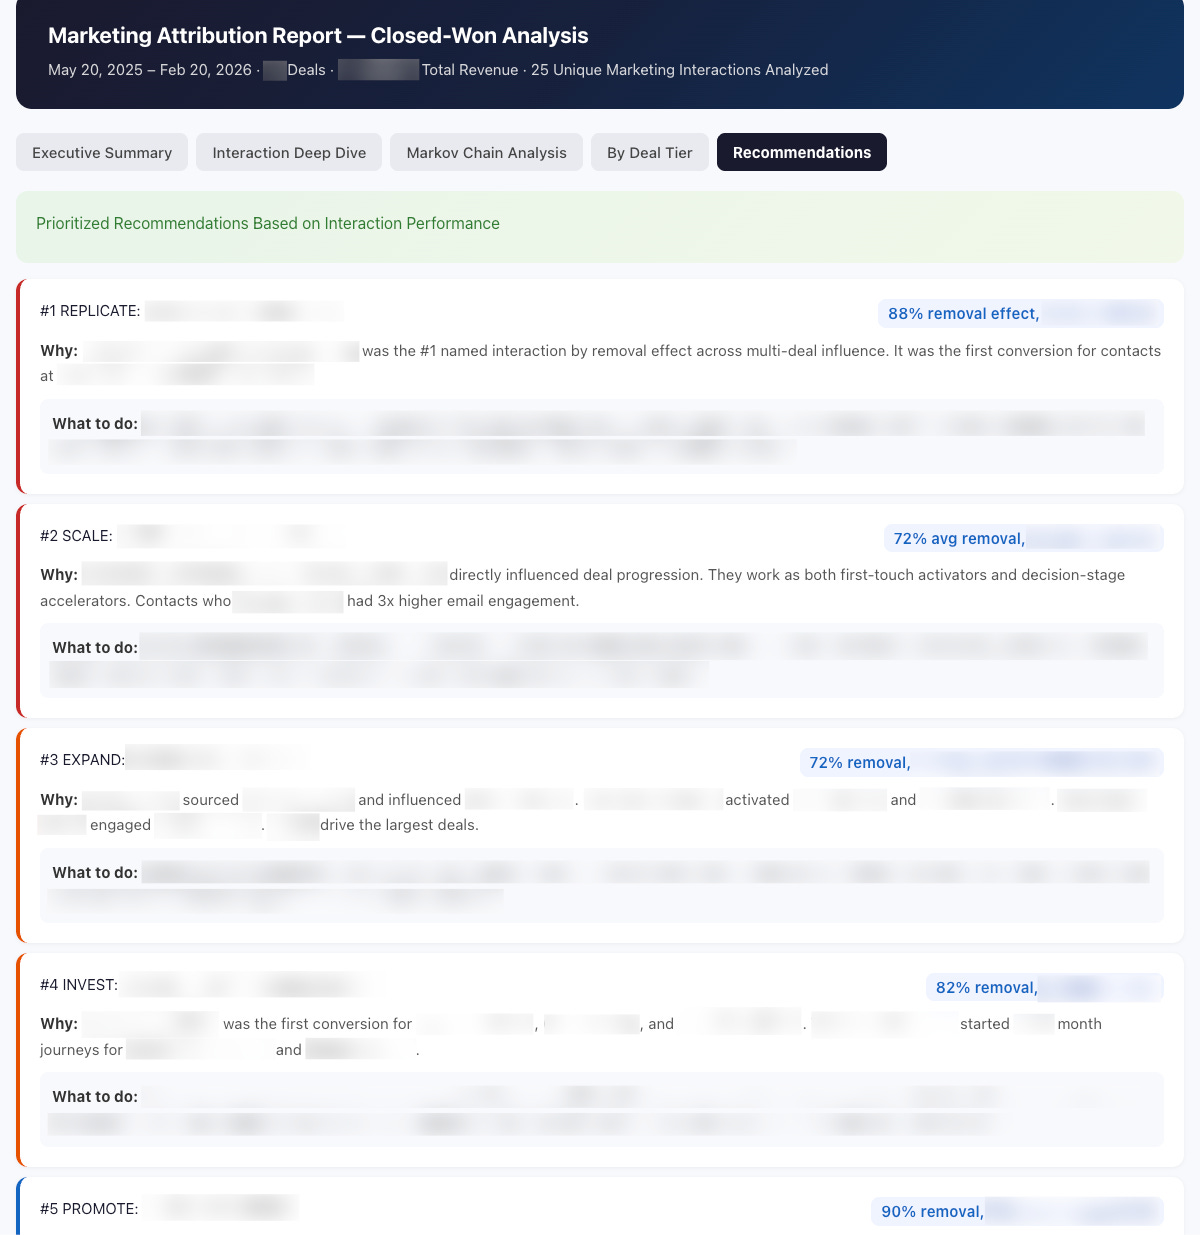
Claude will work through your data and return a structured report — not just text. Expect an executive summary, a breakdown by marketing activity, and a recommendations section. Brant Morton at Rally got a Markov chain analysis on his first try, which he wasn’t even expecting.
Your output looks something like this:
Step 3: Iterate on the Report
Don’t stop at the first output. Keep prompting to go deeper. Try:
“Now show me first touch and last touch attribution separately.”
“Show me the most common activity sequences for your top 20% of deals by deal size.”
“What marketing activities appeared in more than 50% of closed won deals?”
Each follow-up refines the picture. The first report is a starting point, not the final answer.
Step 4: Read the Output Critically
Claude can only read HubSpot contact properties right now — not full activity timelines or custom objects. That means it’s working from fields like first conversion, most recent conversion, and MQL date. The insights are real, but they’re directional. If your report tells you “one-on-one sales emails are your top driver,” that’s probably true — and also not very actionable. Push Claude to surface the marketing signals that aren’t obvious.
Step 5: Screenshot and Document What Surprised You
Before you close the conversation, take screenshots of the sections that surfaced something unexpected. This is your working version. You’ll build on it.
What Good Looks Like
A solid first-pass report gives you: total pipeline influenced, average deal size by segment, the top 3-5 marketing touchpoints correlated with winning, and at least one insight you didn’t already know. Brant’s report surfaced that in-person dinners were showing up in enterprise deals while content downloads were driving smaller ones — a genuine signal that shaped their demand gen priorities.
Watch-Outs
Claude is reading your HubSpot data, which means it’s only as good as what’s actually logged. If your team isn’t consistent about recording activity — or if marketing touches aren’t tracked at the contact level — the report will reflect that. Garbage in, limited insight out.
Also: custom objects in HubSpot are not currently readable by Claude’s connector. If you’ve built custom conversion tracking, you won’t see it here. That’s what Version 2 is for.
The Takeaway
This would have taken a data analyst weeks to build. You did it in one conversation. The report isn’t perfect — but it’s real, it’s based on your actual data, and it gives you something to react to. That’s more than most teams have. Start here, pressure-test the output with your sales and marketing leads, and then decide what you want to go deeper on.
The Advanced Play
How to Build a Full Marketing Attribution App Using HubSpot, Supabase, and Lovable.
Claude’s HubSpot connector is a great starting point. But it has a ceiling: 200K tokens, no custom objects, no full activity timelines. If you want attribution across your entire history — every touchpoint, every channel, every contact — you need to pull the data out of HubSpot and build something on top of it.
The good news: you don’t need a product team to do it. Brant Morton at Rally built this with a $30/month Lovable subscription, a free Supabase table, and a few weekends. It’s running in production.
This is Version 2. Do Version 1 first — it’ll tell you what questions to go answer with this.
Before You Start
HubSpot access with API permissions (you’ll be pulling data via automation, not the Claude connector)
A Make.com or n8n account to set up the HubSpot → Supabase workflow
A Supabase account (free tier works to start)
A Lovable account ($30/month starter tier is enough)
At least one quarter of closed/won deal data in HubSpot with marketing activities logged
Basic comfort with no-code automation — you don’t need to write code, but you need to follow a workflow
Step 1: Set Up Your Supabase Data Table
Create a table in Supabase to receive marketing touchpoint data. You’ll want columns for: contact ID, company ID, event type, event date, campaign, channel, and deal association (if any). This is your attribution database. Everything else gets built on top of it.
Step 2: Build the HubSpot → Supabase Sync in Make or n8n
Create a workflow that fires every time a marketing interaction is logged in HubSpot — email delivery, form submission, ad interaction, webinar attendance, sales call — and writes it to your Supabase table. This is the key architectural decision: instead of asking Claude to re-read everything every time, you’re building a running log that never hits a token limit.
Brant pulled in: marketing email deliveries, ad interactions, sales emails, calls, form submissions, and webinars. That gave him 442,000 touchpoints — way beyond what Claude’s HubSpot connector can handle in a single session.
Step 3: Build the Lovable App on Top of Supabase
Open Lovable and connect it to your Supabase table. Start with a prompt like:
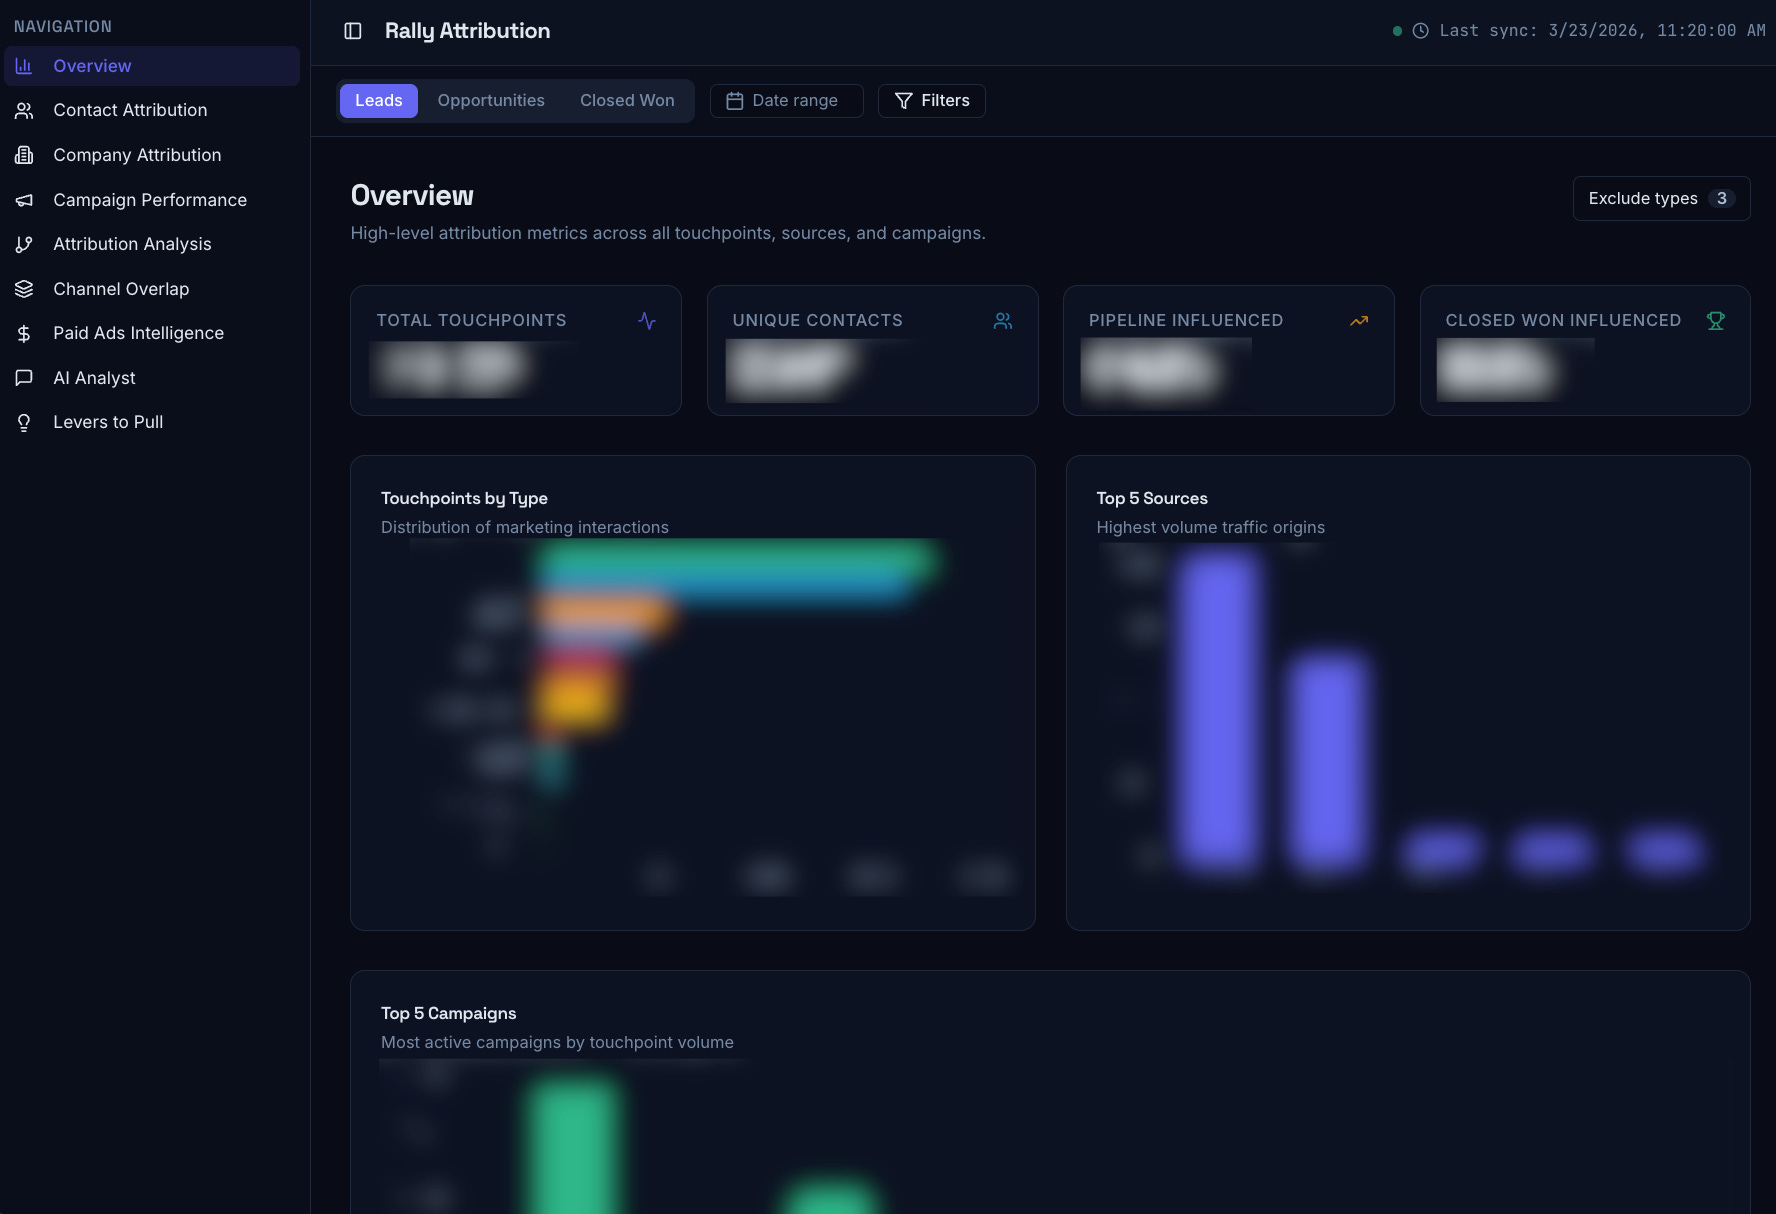
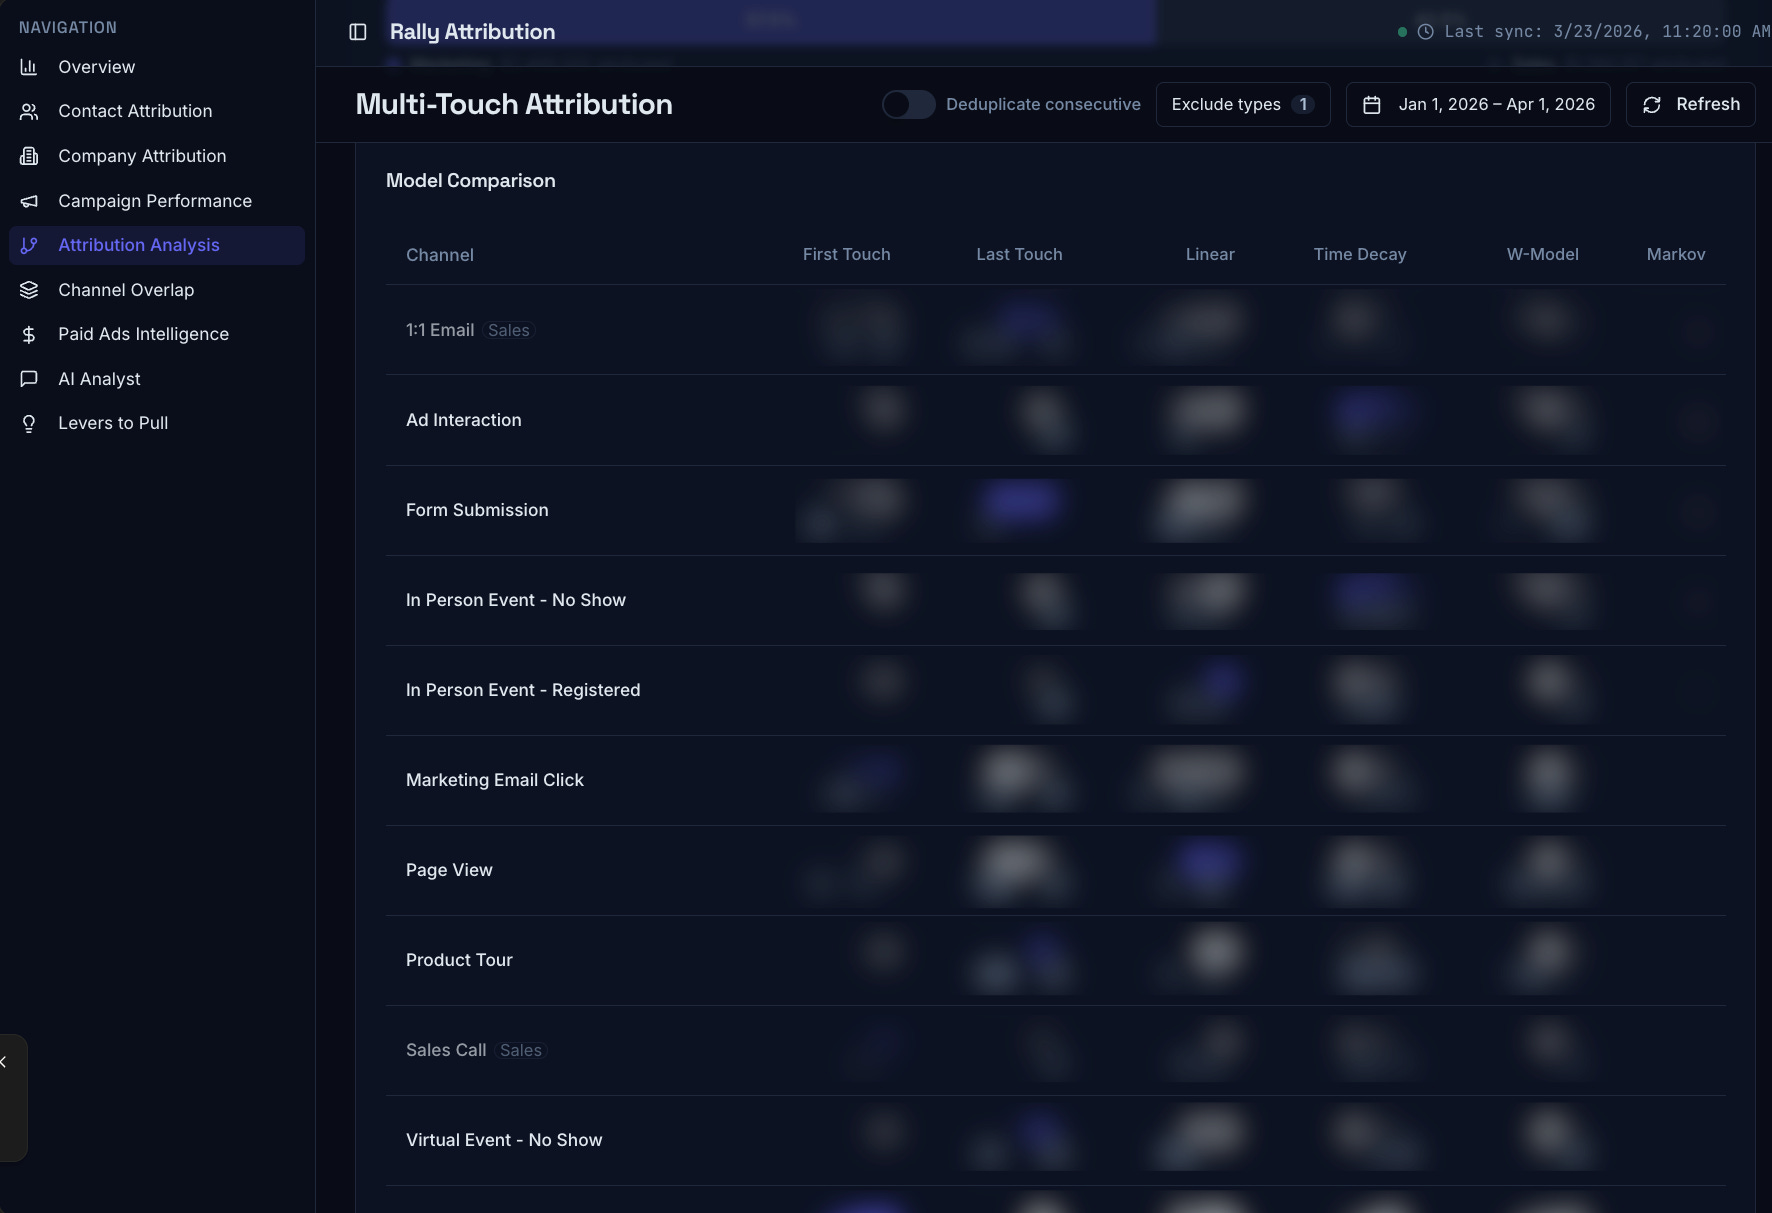
“Build a marketing attribution dashboard connected to my Supabase table [table name]. I want to see: total touchpoints by channel, attribution by model (first touch, last touch, linear, time decay, W-shaped), and a contact-level view that shows every interaction a contact had before a deal closed.”
Lovable will build the app. Iterate from there. Brant added a company rollup view (so you can see activity across all contacts at an account, not just the one on the deal), a paid ads page pulling LinkedIn and Google Ads data, and a “levers to pull” page that surfaces recommendations by attribution model.
Step 4: Add Attribution Models
The real power is running multiple attribution models against the same dataset. Start with first touch and last touch — those are easy. Then add linear and time decay. Markov chain is the most accurate but requires a Python calculation running in the background; Lovable can set it up but you’ll need to fine-tune the logic.
The point isn’t to pick one model as “right.” It’s to see where they agree and disagree — and investigate the gaps.
Step 5: Use It to Ask Better Questions
The dashboard is a question-generator, not a final answer. Use it to surface: which two or three channels show up in almost every closed/won deal, where marketing and sales activity overlap (and where they don’t), and which touchpoints appear in enterprise deals vs. smaller ones. Brant found that in-person dinners correlated with his largest deals — something that never would have surfaced in a standard HubSpot attribution report.
What Good Looks Like
A fully working version of this gives you a live dashboard with six attribution models, contact-level activity timelines, company-level rollups, and a paid ads ROI view — all from your own data, without a third-party attribution platform. Brant built Rally’s version in a weekend
Watch-Outs
Your data quality matters more here than in Version 1 — you’re running actual statistical models. If your team isn’t logging activities consistently, the models will surface noise as signal. Audit your HubSpot data hygiene before you build.
Also: Markov chain analysis requires some tuning. Don’t trust the first output of that model without cross-referencing it against your simpler models.
The Takeaway
Three months ago, standing up a marketing attribution system like this would have required a dedicated PM, a team of engineers, and months of roadmap time. Juliette Kopecky said it clearly: at HubSpot, they had an entire product team devoted to tools like this. Brant built the equivalent over a weekend. That’s not hyperbole — that’s what this moment actually is. The question isn’t whether you can afford to build this. It’s whether you can afford not to know what’s actually driving your revenue.
Special thanks to Brant Morton, GTM Ops, and Juliette Kopecky, CMO, both at Rally, for building this in public and sharing every detail.
 |
|